Fig. 14
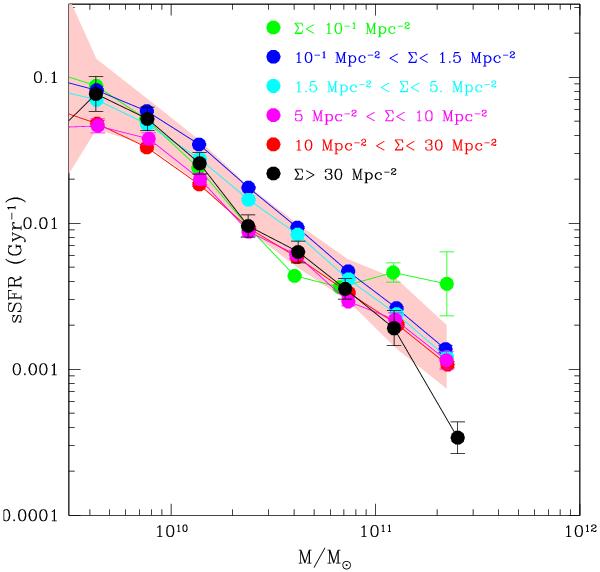
sSFR-stellar mass relation per density bin in the local SDSS star forming sample. The shaded region is the mean relation based on the full star forming sample. The relations are color-coded as a function of density as explained in the figure.
Current usage metrics show cumulative count of Article Views (full-text article views including HTML views, PDF and ePub downloads, according to the available data) and Abstracts Views on Vision4Press platform.
Data correspond to usage on the plateform after 2015. The current usage metrics is available 48-96 hours after online publication and is updated daily on week days.
Initial download of the metrics may take a while.