Fig. 13
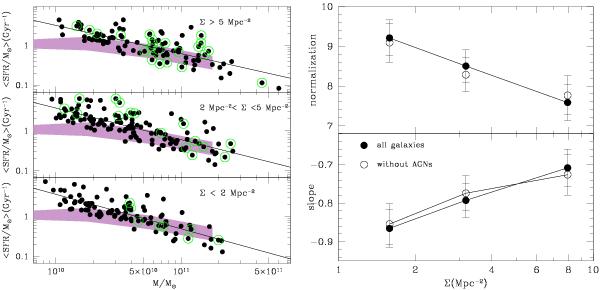
sSFR-stellar mass relation in three density bins (left panel). The green circles identify AGN hosts. The solid line shows the best fit to the relation. The shaded purple region is the relation obtained via stacking in Rodighiero et al. (2010) based on a IRAC selected sample. The right panel shows the best fit parameters (filled points, normalization in the top panel, slope in the bottom panel) as a function of the bin mean density. The empty points show the best fit parameters obtained after excluding the AGN hosts.
Current usage metrics show cumulative count of Article Views (full-text article views including HTML views, PDF and ePub downloads, according to the available data) and Abstracts Views on Vision4Press platform.
Data correspond to usage on the plateform after 2015. The current usage metrics is available 48-96 hours after online publication and is updated daily on week days.
Initial download of the metrics may take a while.