Fig. 3
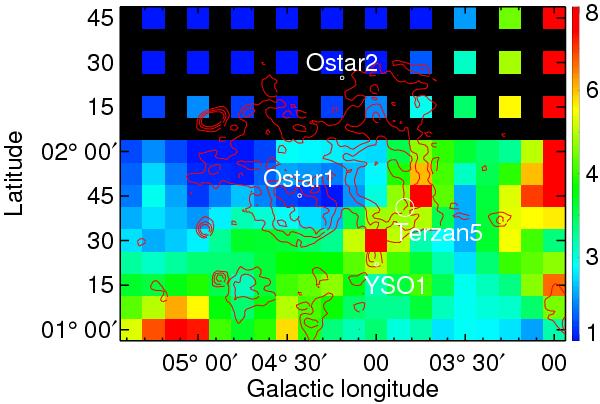
Map of nH2 derived from the 12CO emission in the 3 to 10 km s-1 velocity range (roughly equivalent to a distance range of 1 to 3 kpc) overlaid with contours from the 11 cm data (for levels 0.07, 0.095 and 0.12 Jy/beam) and selected objects (see Sect. 5). The Terzan 5 circle indicates the half-mass radius of the GC. Colour scale normalised by 1020 cm-2. The map was blanked where no value was available.
Current usage metrics show cumulative count of Article Views (full-text article views including HTML views, PDF and ePub downloads, according to the available data) and Abstracts Views on Vision4Press platform.
Data correspond to usage on the plateform after 2015. The current usage metrics is available 48-96 hours after online publication and is updated daily on week days.
Initial download of the metrics may take a while.