Fig. 6
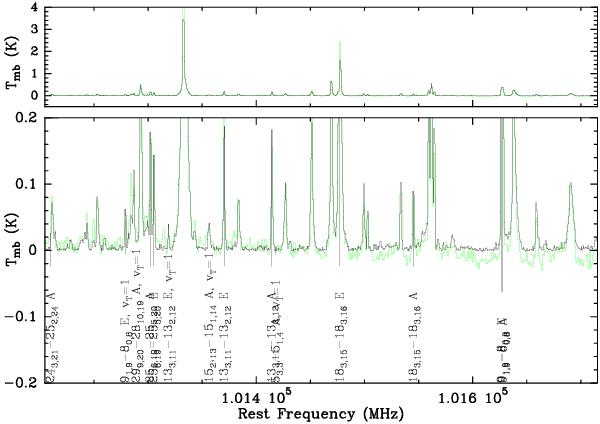
Spectra of molecular emission at 3 mm toward the Compact Ridge. The lower panel is a blow up of the upper one. Green lines show IRAM 30-m telescope data of Combes et al. (1996), and black lines illustrate PdBI data (set No. 3, see Table 1) convolved with the 30-m beam. A and E transitions of HCOOCH3 are marked in the figure.
Current usage metrics show cumulative count of Article Views (full-text article views including HTML views, PDF and ePub downloads, according to the available data) and Abstracts Views on Vision4Press platform.
Data correspond to usage on the plateform after 2015. The current usage metrics is available 48-96 hours after online publication and is updated daily on week days.
Initial download of the metrics may take a while.