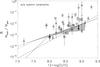
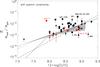
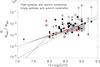
Fig. 7

a) Dust-to-gas mass ratio as a function of oxygen abundance for our restricted sample of galaxies that were observed at submm wavelengths. For the convention on symbols, refer to Fig. 4. Red symbols show the galaxies that present a submm excess and for which a cold dust (10 K) component with an emissivity β = 1 is added. In this plot, the dust masses of the galaxies are derived from our SED models without introducing submm observational constraints. The solid line and the dotted line are the predictions of the dust formation models from Edmunds (2001). The gray stripe is the expectation of the one-zone, single-phase chemical evolution model of Dwek (1998) presented in Galliano et al. (2008). Both models are presented in Sect. 2. The dashed line is the linear regression of the broad sample of Sect. 2 where all galaxies, including those without submm data, are used. b) Same but the dust masses of the galaxies are derived from our SED models using submm observational data. Labeled galaxies are discussed in Sect. 4.1. Error bars refer to errors in the dust mass estimates and do not take the gas mass errors into account. c) We gather the two previous plots to emphasize how the D/G “moves” (dot-dash vertical lines) in the diagram when submm data are used to estimate the dust mass in the SED modelling.
Current usage metrics show cumulative count of Article Views (full-text article views including HTML views, PDF and ePub downloads, according to the available data) and Abstracts Views on Vision4Press platform.
Data correspond to usage on the plateform after 2015. The current usage metrics is available 48-96 hours after online publication and is updated daily on week days.
Initial download of the metrics may take a while.