Fig. 4
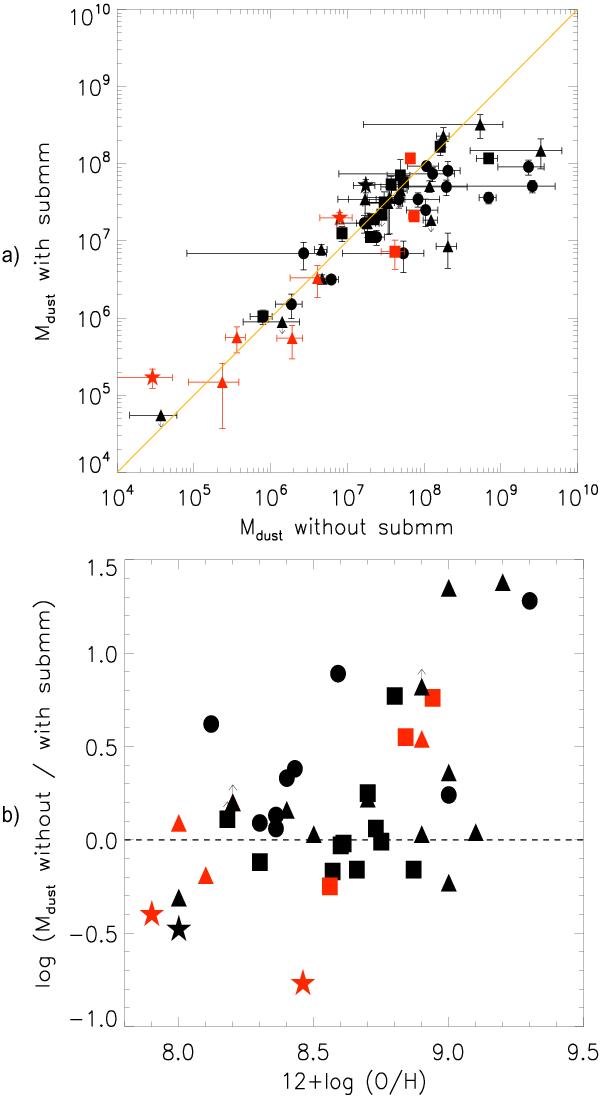
a) Total dust mass estimated with submm observations versus total mass of dust estimated without submm observations. The line shows the 1:1 relation. Squares indicate the James et al. (2002) galaxies. Circles indicate the galaxies of the SINGS survey (Draine et al. 2007) for which metallicity is already published. Triangles are the Galliano et al. (2008) sample and stars indicate the location of the three galaxies Haro 11, NGC 1705 and Mrk 1089 of Galametz et al. (2009). Red symbols show the galaxies that present a submm excess and for which a cold dust (10 K) component with an emissivity β = 1 is added. b) Evolution of the ratio of the total mass of dust estimated with and without submm data as a function of the oxygen abundance of the galaxy.
Current usage metrics show cumulative count of Article Views (full-text article views including HTML views, PDF and ePub downloads, according to the available data) and Abstracts Views on Vision4Press platform.
Data correspond to usage on the plateform after 2015. The current usage metrics is available 48-96 hours after online publication and is updated daily on week days.
Initial download of the metrics may take a while.