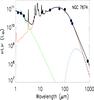
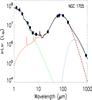
Fig. 3
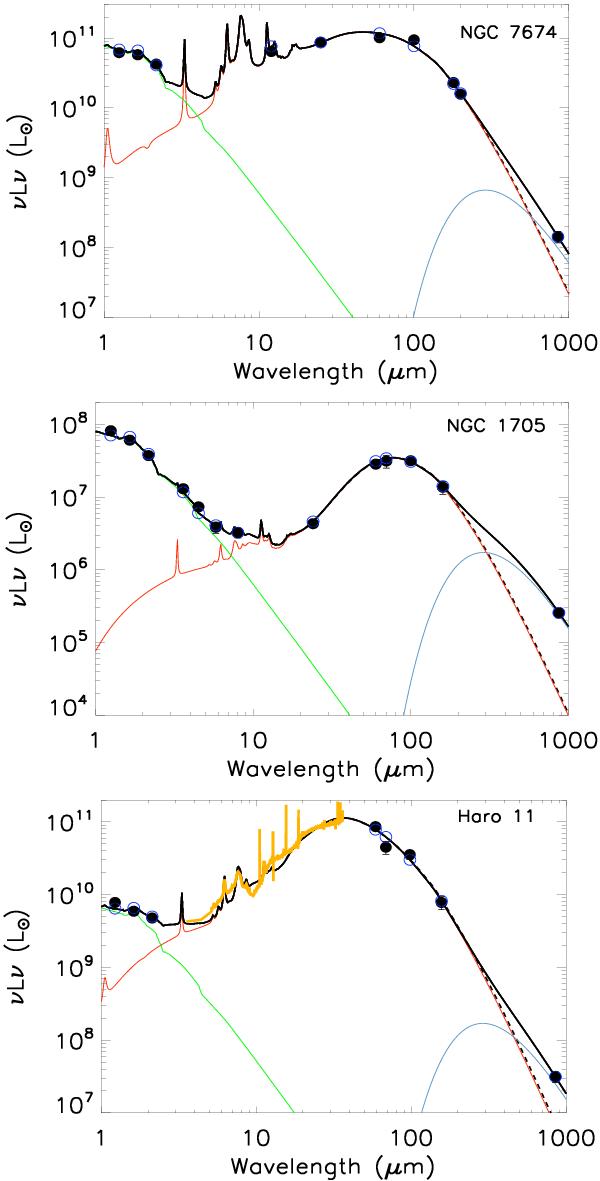
SED models of the galaxies for which an excess at submm wavelengths is detected. The SEDs modelled with submm data are indicated by the black lines while the dashed black lines indicates the model obtained when submm data are omitted in the modelling. Observational constraints are superimposed (filled circles). When the error bars are not shown, the errors are smaller than symbols. The thick orange line shows the IRS spectrum used in the SED modelling when available. The open circles indicate the expected modelled fluxes integrated over the instrumental bands. The green, red and blue lines respectively distinguish the stellar, the warm dust and the cold dust contributions to the SED determined with submm data.
Current usage metrics show cumulative count of Article Views (full-text article views including HTML views, PDF and ePub downloads, according to the available data) and Abstracts Views on Vision4Press platform.
Data correspond to usage on the plateform after 2015. The current usage metrics is available 48-96 hours after online publication and is updated daily on week days.
Initial download of the metrics may take a while.