Fig. 9

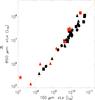
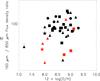
a) Correlation between the 160 μm and the 850 μm fluxes of the galaxies. A linear regression is overlaid (dashed line). When the galaxies do not possess an observational constraint at 850 μm, the flux value was deduced from the SED model. b) 160 μm/850 μm flux density ratios as a function of metallicity. For convention on colors and symbols, see Fig. 4. Red symbols show the galaxies that present a submm excess and for which a cold dust (10 K) component with an emissivity β = 1 is added.
Current usage metrics show cumulative count of Article Views (full-text article views including HTML views, PDF and ePub downloads, according to the available data) and Abstracts Views on Vision4Press platform.
Data correspond to usage on the plateform after 2015. The current usage metrics is available 48-96 hours after online publication and is updated daily on week days.
Initial download of the metrics may take a while.