Fig. 1
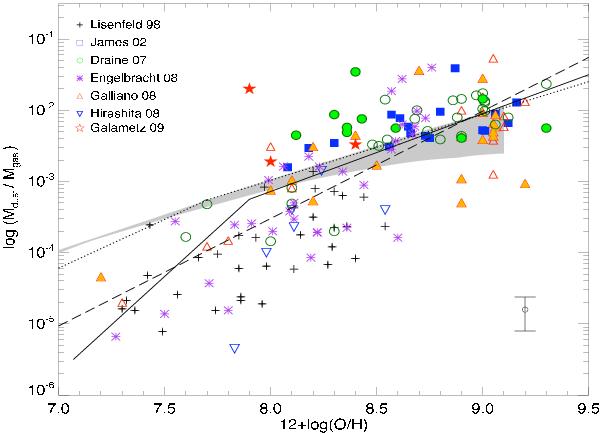
Dust-to-gas mass ratio as a function of oxygen abundance. Black crosses show the Lisenfeld & Ferrara (1998) sample of blue compact galaxies and dwarf irregulars. Purple asterisks show the Engelbracht et al. (2008) sample using Spitzer data. Blue squares indicate the James et al. (2002) galaxies. Green circles show the galaxies of the SINGS survey (Draine et al. 2007) for which metallicity is already published. Orange upward triangles are the Galliano et al. (2008) sample, blue downward triangles are the Hirashita et al. (2008) sample. Stars finally indicate the location of the three low-metallicity galaxies Haro 11, NGC 1705 and Mrk 1089 of Galametz et al. (2009). Filled triangles, squares, circles or stars indicate when submm data were used in the SED modelling to estimate the total dust mass of the SED. The solid line and the dotted line are the predictions of the dust formation models from Edmunds (2001): the solid line shows a model in which dust is produced in low and intermediate mass stars while the dotted line shows the model in which supernovae play an important role in the production of dust. The gray stripe is the expectation of the one-zone, single-phase chemical evolution model of Dwek (1998) presented in Galliano et al. (2008). The dashed line shows the linear regression of the whole sample. The D/G errors can be significant for many galaxies but should not exceed ± 50% (the ± 50% error bars are plotted on the bottom right part of the plot).
Current usage metrics show cumulative count of Article Views (full-text article views including HTML views, PDF and ePub downloads, according to the available data) and Abstracts Views on Vision4Press platform.
Data correspond to usage on the plateform after 2015. The current usage metrics is available 48-96 hours after online publication and is updated daily on week days.
Initial download of the metrics may take a while.