Fig. 2
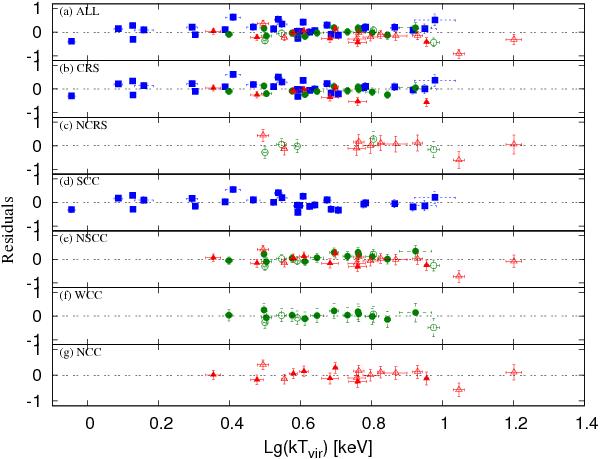
The lg-space residuals in LX for each category with respect to their individual best fits. The symbol representation is the same as in Fig. 1. The errorbars for each subgroup are obtained from summing the uncertainties in the measured and the fitted luminosities in quadrature. The fitted luminosities for a subgroup are obtained through the best-fit LX − Tvir relation of that subgroup.
Current usage metrics show cumulative count of Article Views (full-text article views including HTML views, PDF and ePub downloads, according to the available data) and Abstracts Views on Vision4Press platform.
Data correspond to usage on the plateform after 2015. The current usage metrics is available 48-96 hours after online publication and is updated daily on week days.
Initial download of the metrics may take a while.