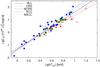
Fig. 1

LX − Tvir relation for the HIFLUGCS sample of clusters. The filled symbols represent clusters with a central radio source and the open symbols represent those without. The squares (blue), circles (green), and triangles (red) represent strong cool-core clusters (tcool < 1 Gyr), weak cool-core clusters (1 Gyr < tcool < 7.7 Gyr), and non-cool-core clusters (tcool > 7.7 Gyr), respectively.
Current usage metrics show cumulative count of Article Views (full-text article views including HTML views, PDF and ePub downloads, according to the available data) and Abstracts Views on Vision4Press platform.
Data correspond to usage on the plateform after 2015. The current usage metrics is available 48-96 hours after online publication and is updated daily on week days.
Initial download of the metrics may take a while.