Fig. 4
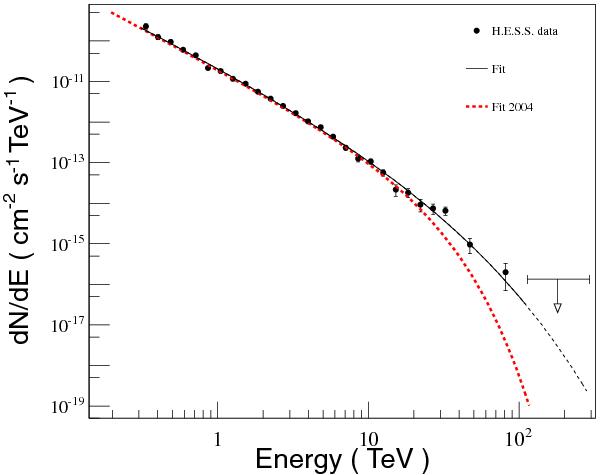
Combined H.E.S.S. gamma-ray spectrum of RX J1713.7−3946 generated from data of 2003, 2004, and 2005 (Data set III, Table 1). Data are corrected for the variation in optical efficiency. Error bars are ± 1σ statistical errors. These data might be described by a power law with exponential cutoff of the form dN/dE = I0 E − Γ exp( − (E/Ec)β). The best-fit result (black solid line) is given here for β = 0.5 (fixed), Γ = 1.8, and Ec = 3.7 TeV (cf. Table 4 for the exact values). Note that the fit function extends as dashed black line beyond the fit range for illustration. For comparison, the best fit of a power law with exponential cutoff and β = 1, obtained solely from the 2004 data (Aharonian et al. 2007), is shown as dashed red line. A model-independent upper limit, indicated by the black arrow, is determined in the energy range from 113 to 300 TeV.
Current usage metrics show cumulative count of Article Views (full-text article views including HTML views, PDF and ePub downloads, according to the available data) and Abstracts Views on Vision4Press platform.
Data correspond to usage on the plateform after 2015. The current usage metrics is available 48-96 hours after online publication and is updated daily on week days.
Initial download of the metrics may take a while.