Fig. 6
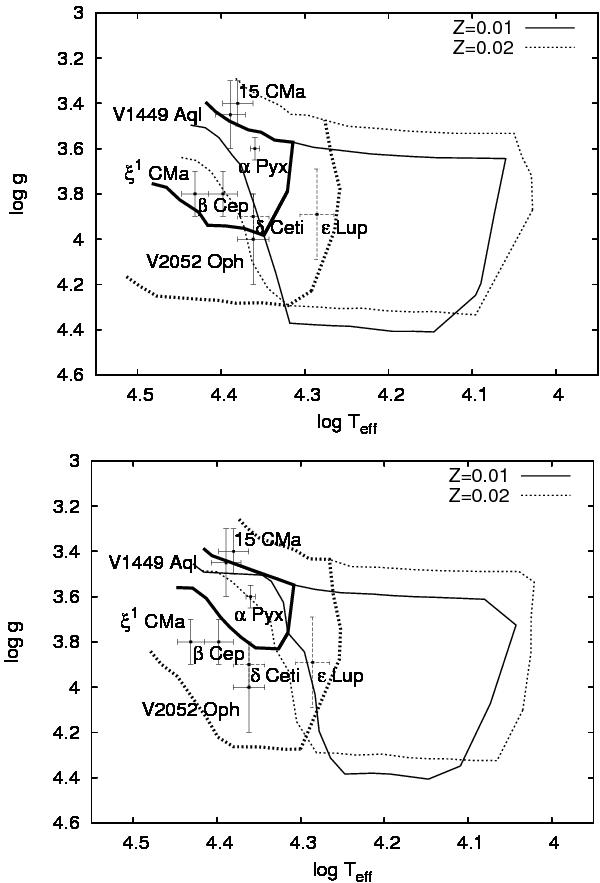
The position of the β Cephei and candidate β Cephei stars in the H-R diagram. Upper panel: the boundaries of the theoretical instability strips are calculated using the OP opacities. Lower panel: boundaries are calculated using OPAL opacities. Full lines correspond to strips for metallicity Z = 0.01 and dotted lines to strips with metallicity Z = 0.02. The thick and thin lines correspond to the boundaries of the β Cephei and SPB instability regions, respectively.
Current usage metrics show cumulative count of Article Views (full-text article views including HTML views, PDF and ePub downloads, according to the available data) and Abstracts Views on Vision4Press platform.
Data correspond to usage on the plateform after 2015. The current usage metrics is available 48-96 hours after online publication and is updated daily on week days.
Initial download of the metrics may take a while.