Fig. 1
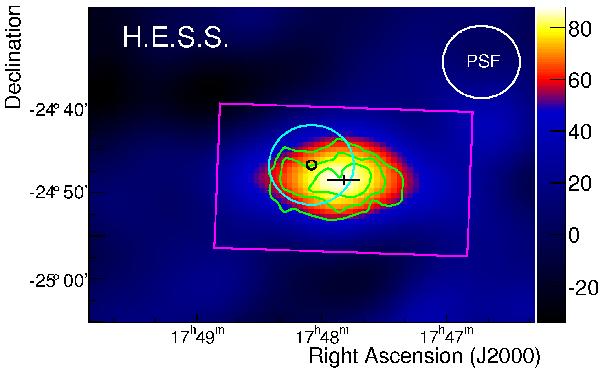
Exposure-corrected excess image from the HESS data, smoothed with a Gaussian function of width 0.1° and overlaid with significance contours (4–6σ) in RADec J2000 coordinates. The circles show the half-mass radius (in black) and the larger tidal radius (in cyan) of the GC. The cross indicates the best-fit source position of HESS J1747−248, assuming a 2D Gaussian shape, with 1σ uncertainty on each axis. The rectangle represents the integration region used for the full-source spectral analysis. The upper-right corner circle illustrates the instrumental PSF.
Current usage metrics show cumulative count of Article Views (full-text article views including HTML views, PDF and ePub downloads, according to the available data) and Abstracts Views on Vision4Press platform.
Data correspond to usage on the plateform after 2015. The current usage metrics is available 48-96 hours after online publication and is updated daily on week days.
Initial download of the metrics may take a while.