Fig. 4
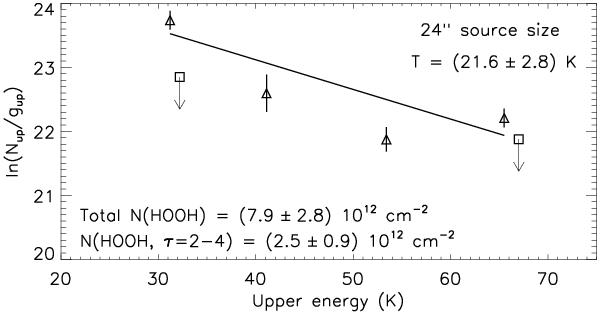
HOOH rotation diagram. The detected lines (only τ = 2 ↔ 4 lines) are shown as open triangles with error bars. The size of the error bars corresponds to the total uncertainty (noise and calibration). The 3σ upper limits (not included in the fit) are shown as open squares and downward arrows and originate from transitions between τ = 1,3 states. The fitted rotation temperature is noted, as is the total column density. The column density for unpopulated τ = 1,3 states is also given.
Current usage metrics show cumulative count of Article Views (full-text article views including HTML views, PDF and ePub downloads, according to the available data) and Abstracts Views on Vision4Press platform.
Data correspond to usage on the plateform after 2015. The current usage metrics is available 48-96 hours after online publication and is updated daily on week days.
Initial download of the metrics may take a while.