Fig. 2
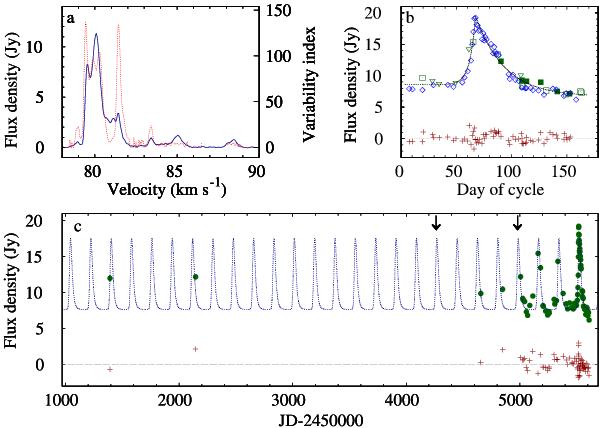
a) Average 6.7 GHz maser line profile of G22.357+0.066 (blue line) with the variability index VI1 superimposed (red dotted line). b) Folded flare profile at 80.1 km s-1 feature. The dotted line represents the best fit to the curve. The symbols mark different cycles. c) Time series for the 80.1 km s-1 feature with the best-fit curve superimposed. The arrows mark the dates of the EVN observations. The residuals from the fittings in b) and c) are shown by the crosses.
Current usage metrics show cumulative count of Article Views (full-text article views including HTML views, PDF and ePub downloads, according to the available data) and Abstracts Views on Vision4Press platform.
Data correspond to usage on the plateform after 2015. The current usage metrics is available 48-96 hours after online publication and is updated daily on week days.
Initial download of the metrics may take a while.