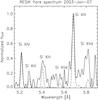
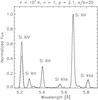
Fig. 5
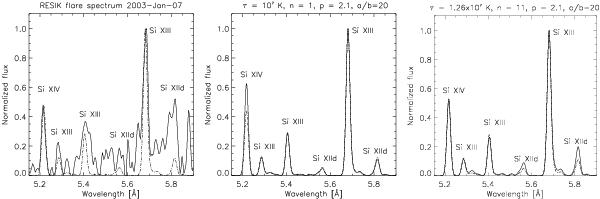
Observed and synthetic spectra. Left: spectrum observed by RESIK (full line) together with a synthetic isothermal Maxwellian spectrum (dash-dotted line) with log(T/K) = 7.01. Middle: synthetic spectrum for the composed np-distribution with n = 1, p = 2.1, a/b = 20, and log(τ/K) = 7.0 and the Maxwellian spectrum with the same log(T/K) = 7.0. Right: synthetic spectrum for the composed np-distribution with n = 11, p = 2.1, a/b = 20, and log(τ/K) = 7.1 compared to the Maxwellian spectrum with log(T/K) = 7.02.
Current usage metrics show cumulative count of Article Views (full-text article views including HTML views, PDF and ePub downloads, according to the available data) and Abstracts Views on Vision4Press platform.
Data correspond to usage on the plateform after 2015. The current usage metrics is available 48-96 hours after online publication and is updated daily on week days.
Initial download of the metrics may take a while.