Fig. 3
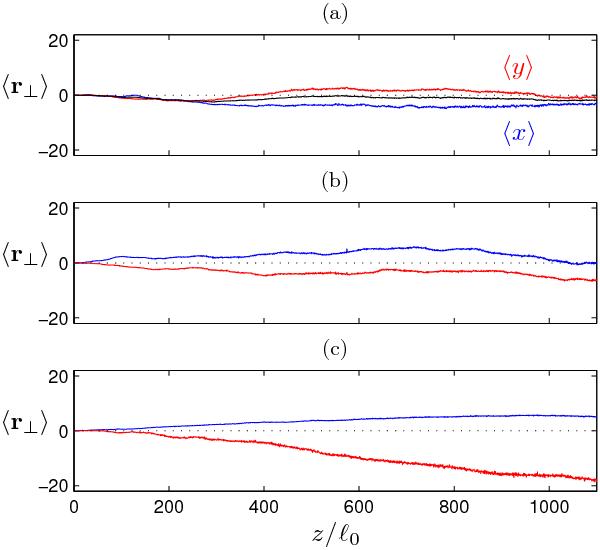
Mean perpendicular coordinate in isotropic magnetostatic turbulence. In panel a) the axisymmetric case is shown, whereas in panels b) and c) the turbulent wave vectors are confined to a cone with the opening angle  and
and  , respectively. In all panels, the blue and red lines show the components ⟨ x ⟩ and ⟨ y ⟩ , respectively, whereas the black line in panel a) shows the averaged perpendicular displacement.
Current usage metrics show cumulative count of Article Views (full-text article views including HTML views, PDF and ePub downloads, according to the available data) and Abstracts Views on Vision4Press platform.
Data correspond to usage on the plateform after 2015. The current usage metrics is available 48-96 hours after online publication and is updated daily on week days.
Initial download of the metrics may take a while.