Free Access
Fig. 5
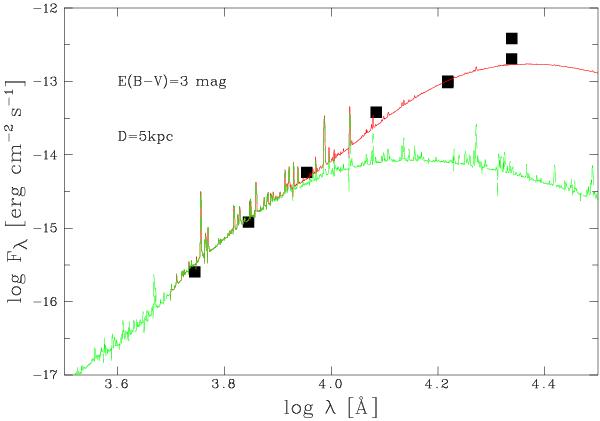
Comparison between the broadband photometry of W239 and the reddened WC+O spectral energy distribution excluding (green dashed line) and including (red solid line) the simple 1300 K graybody dust model. Optical photometry from Clark et al. (2005, 2001 August 21) and the near-IR from 2005 June 3 & July 31 (this work).
Current usage metrics show cumulative count of Article Views (full-text article views including HTML views, PDF and ePub downloads, according to the available data) and Abstracts Views on Vision4Press platform.
Data correspond to usage on the plateform after 2015. The current usage metrics is available 48-96 hours after online publication and is updated daily on week days.
Initial download of the metrics may take a while.