Fig. 9
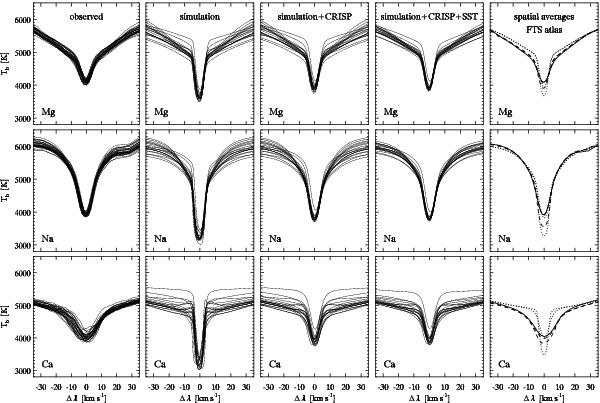
Sample profiles of the cores of the Mg line (top row), Na line (second row), and Ca line (third row), for every 50th pixel in x and y in Figs. 4 and 5, respectively. First column: observed profiles. Second column: original synthetic profiles from the simulation. Third column: synthetic profiles spectrally smeared with the CRISP transmission profile. Fourth column: additional smearing with the estimated SST point spread function. The smearing was applied to the computed intensities, not the brightness temperatures. Final column: mean profiles. The solid curves are the observed full-field means, the dotted curves the simulation means without smearing and with CRISP and SST smearing (the latter does not affect the spatial mean). The dashed curves are the FTS atlas profiles without and with CRISP smearing. All panels cover the same coordinate ranges.
Current usage metrics show cumulative count of Article Views (full-text article views including HTML views, PDF and ePub downloads, according to the available data) and Abstracts Views on Vision4Press platform.
Data correspond to usage on the plateform after 2015. The current usage metrics is available 48-96 hours after online publication and is updated daily on week days.
Initial download of the metrics may take a while.