Fig. 8
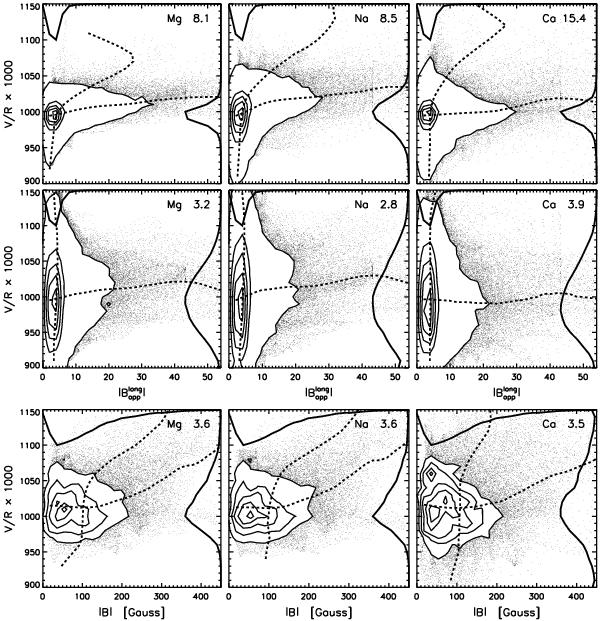
Scatter diagrams of the core asymmetry ratio  against field strength. Upper two rows: observations, using the full field of view. The abscissa is the magnitude of the apparent longitudinal flux density measured from the Fe I 6302 Å magnetogram, in arbitrary units and after 9-pixel spatial smoothing to mimic field spreading with height. Bottom row: smeared simulation. The abscissa is the magnitude of the vector field at height z = 500 km. Left: Mg line. Center: Na line. Right: Ca line. The sampling wavelength in kms-1 is specified in each panel. The V/R values are multiplied by 1000 for plotting reasons. Density contours replace individual pixels to avoid plot saturation. The solid curves are the distributions over V/R and field strength, respectively. The dashed curves show the first moments per bin per axis. They line up for high correlation and are perpendicular at no correlation.
Current usage metrics show cumulative count of Article Views (full-text article views including HTML views, PDF and ePub downloads, according to the available data) and Abstracts Views on Vision4Press platform.
Data correspond to usage on the plateform after 2015. The current usage metrics is available 48-96 hours after online publication and is updated daily on week days.
Initial download of the metrics may take a while.