Fig. 7
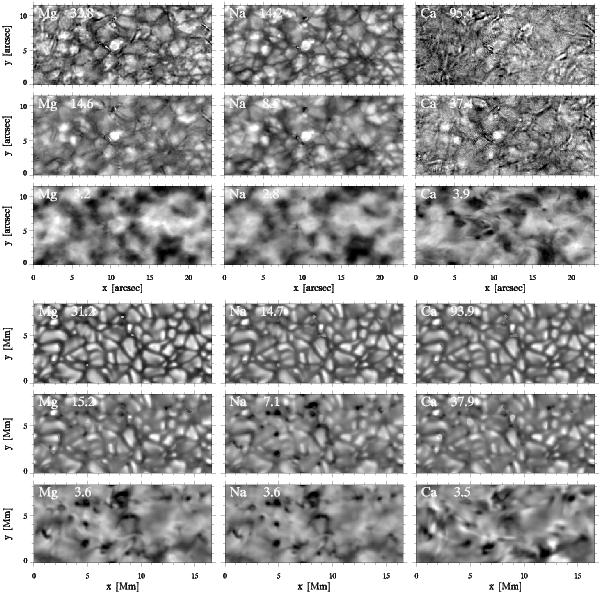
Upper assembly: observed brightness-temperature Dopplergrams for the three lines in the format of Fig. 4. Each panel displays the normalized Dopplergram subtraction  , with bright implying blueshift (updraft) for spectral absorption features and redshift (downdraft) for spectral emission features. The grayscale is defined so that D = 0 is represented by the same gray in all panels while the ranges are adapted per panel for largest contrast. The separations from line center Δλ, specified in kms-1 in each panel, are the same as in Fig. 4. Lower assembly: corresponding results from the smeared simulation. The Δλ values are the same as in Figs. 5 and 6.
Current usage metrics show cumulative count of Article Views (full-text article views including HTML views, PDF and ePub downloads, according to the available data) and Abstracts Views on Vision4Press platform.
Data correspond to usage on the plateform after 2015. The current usage metrics is available 48-96 hours after online publication and is updated daily on week days.
Initial download of the metrics may take a while.