Fig. 5
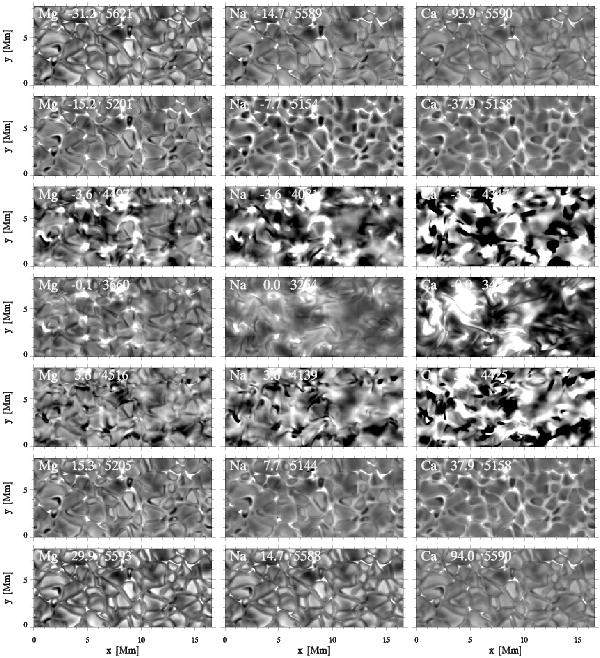
Simulated brightness-temperature images for selected monochromatic wavelengths sampling the profiles of the Mg line (first column), Na line (second column), and Ca line (third column). The area equals the observed subfield in Fig. 4 in size. The format, labels and grayscales correspond to those of Fig. 4, i.e., each panel is again clipped at ΔTb = ± 400 K relative to the spatially averaged mean. The wavelength selection, again specified in Dopplershift units, corresponds to the selection in Fig. 4, i.e., near-equal FALC formation height of about 65 km and 150 km along the outer rows and near-equal wavelength offset Δλ from the nominal line center in Dopplershift units across the middle three rows, of which the center one samples nominal line center.
Current usage metrics show cumulative count of Article Views (full-text article views including HTML views, PDF and ePub downloads, according to the available data) and Abstracts Views on Vision4Press platform.
Data correspond to usage on the plateform after 2015. The current usage metrics is available 48-96 hours after online publication and is updated daily on week days.
Initial download of the metrics may take a while.