Fig. 4
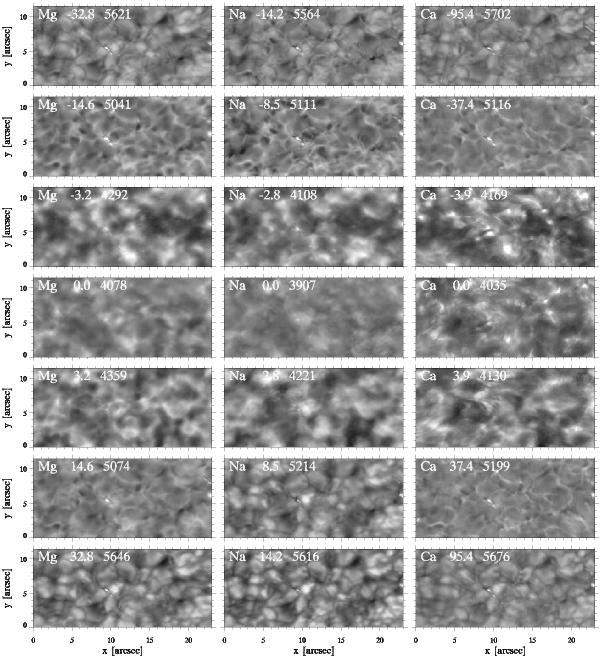
Observed brightness-temperature images for selected wavelengths sampling the profiles of the Mg line (first column), Na line (second column), and Ca line (third column). The area is a small cutout of the center of the full field of view that corresponds in size to the horizontal extent of the numerical simulation. The identifier in each panel specifies the line, the CRISP passband offset from line center in kms-1 with redshift positive, and the mean brightness temperature over the full field of view. The grayscale range of each panel is clipped at ΔTb = ± 400 K relative to this mean, so that each panel covers the same brightness temperature range in magnitude. The passband offsets select equal FALC formation height across the first and last two rows (optical depth unity near h = 65 and 150 km, respectively) and near-equal wavelength offset Δλ from the nominal line center wavelength in Dopplershift units across the middle three rows (about Δλ = −3, 0, and + 3 kms-1, respectively). The selections are symmetrical with respect to line center (central row).
Current usage metrics show cumulative count of Article Views (full-text article views including HTML views, PDF and ePub downloads, according to the available data) and Abstracts Views on Vision4Press platform.
Data correspond to usage on the plateform after 2015. The current usage metrics is available 48-96 hours after online publication and is updated daily on week days.
Initial download of the metrics may take a while.