Fig. 3
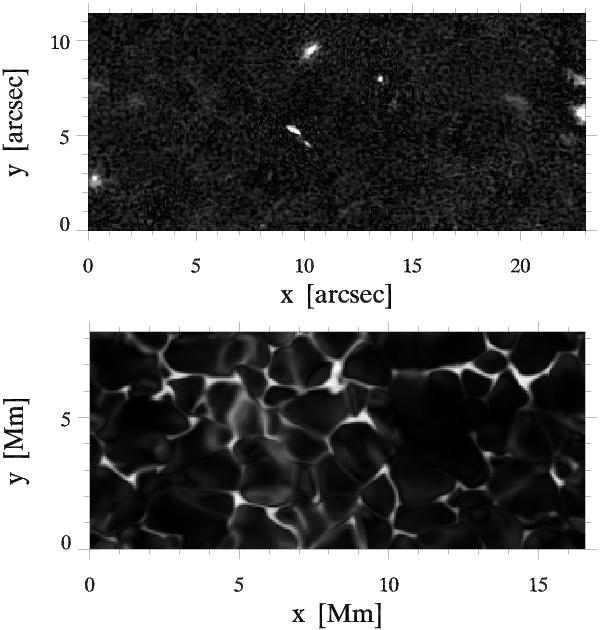
Unsigned magnetic field distributions. Top: observed Stokes-V amplitude at Δλ = −0.048 Å in the Fe I 6302 Å line for the subfield. Only a few small magnetic concentrations have signal above the noise. The two major ones near x = 10 have opposite polarity. Bottom: field amplitude in the simulation at h = 0 km, corresponding to spatially-averaged τ5 = 1 in the continuum at λ = 5000 Å. The field is bipolar, as shown in Fig. 5 of Leenaarts et al. (2010). Throughout this paper image scales are in arcsec, simulation scales in Mm. The two areas have equal solar-surface extent.
Current usage metrics show cumulative count of Article Views (full-text article views including HTML views, PDF and ePub downloads, according to the available data) and Abstracts Views on Vision4Press platform.
Data correspond to usage on the plateform after 2015. The current usage metrics is available 48-96 hours after online publication and is updated daily on week days.
Initial download of the metrics may take a while.