Fig. 2
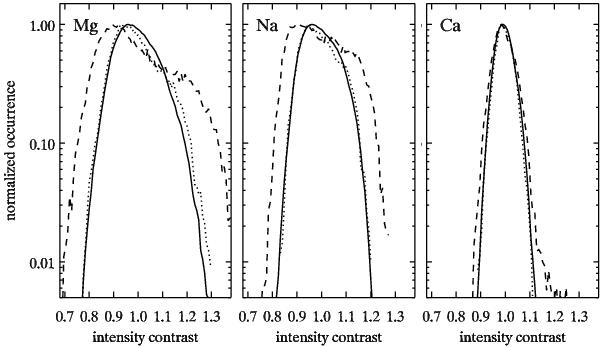
Intensity contrast comparisons for the three lines between observations (solid), simulation (dashed), and the smeared simulation (dotted). Each curve shows the normalized occurrence distribution of pixels with the given contrast (intensity divided by the spatial mean) for the sum of the blue and red outermost-wing image pairs.
Current usage metrics show cumulative count of Article Views (full-text article views including HTML views, PDF and ePub downloads, according to the available data) and Abstracts Views on Vision4Press platform.
Data correspond to usage on the plateform after 2015. The current usage metrics is available 48-96 hours after online publication and is updated daily on week days.
Initial download of the metrics may take a while.