Fig. 15
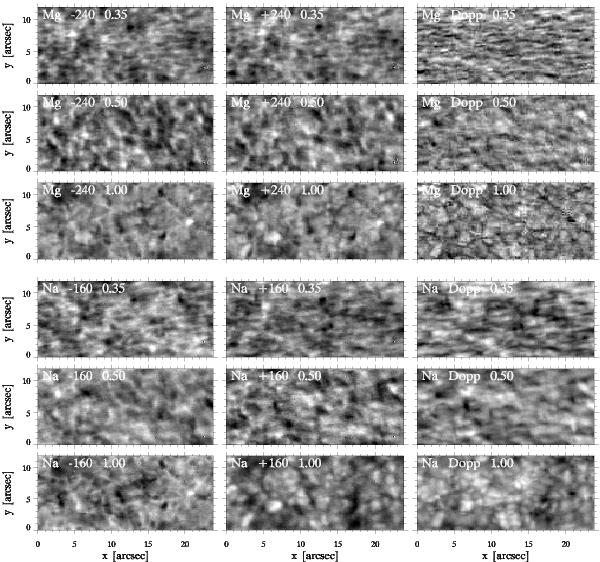
Comparable intensity images from Hinode in the Mg line (upper half) and Na line (lower half). Each panel is independently grayscaled for optimum contrast. The subfield has the same size as in Figs. 4–7. Along rows the images cover the same scene, with about 32 s delay between the two lines. The viewing angle differs between rows, with μ = 0.35, 0.50 and 1.00 as specified. The limb is to the top. The first two columns are images in the blue and red wing at Δλ = ± 240 mÅ for the Mg line, Δλ = ± 160 mÅ for the Mg line. The third column has the corresponding (Ired − Iblue)/(Ired + Iblue) Dopplergrams.
Current usage metrics show cumulative count of Article Views (full-text article views including HTML views, PDF and ePub downloads, according to the available data) and Abstracts Views on Vision4Press platform.
Data correspond to usage on the plateform after 2015. The current usage metrics is available 48-96 hours after online publication and is updated daily on week days.
Initial download of the metrics may take a while.