Free Access
Fig. 14
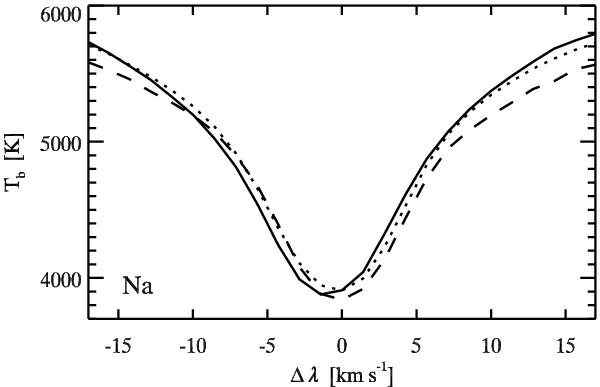
Representative observed Na-line profiles to illustrate the cause of imaging asymmetries in granulation and reversed granulation. Solid: pixel at the center of a granule. Dashed: pixel in an intergranular lane. Dotted: spatial average.
Current usage metrics show cumulative count of Article Views (full-text article views including HTML views, PDF and ePub downloads, according to the available data) and Abstracts Views on Vision4Press platform.
Data correspond to usage on the plateform after 2015. The current usage metrics is available 48-96 hours after online publication and is updated daily on week days.
Initial download of the metrics may take a while.