Fig. 13
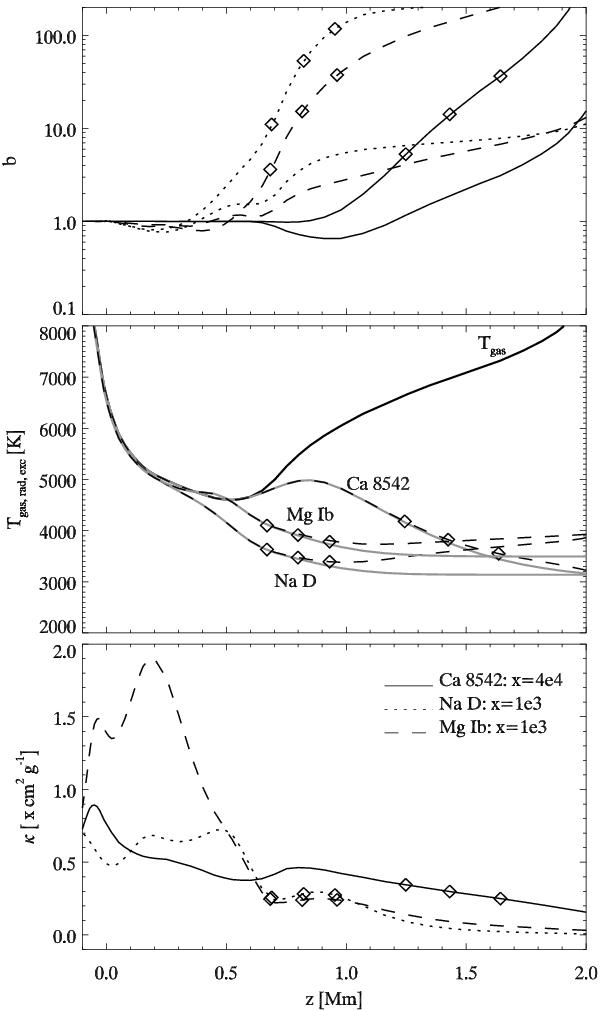
Formation parameters of the three lines in the standard 1D model atmosphere of Fontenla et al. (1993) against geometrical height. The symbols mark the heights where the total optical depth at line center reaches 0.3, 1 and 3, respectively. Top panel: NLTE population departure coefficients b for the Mg line (dashed), Na line (dotted) and Ca line (solid). The optical depth marks are superimposed on the lower-level curves. Middle panel: total (opacity-weighted line plus continuum) source function in the form of a formal temperature Texc (dashed) and mean radiation field in the form of a formal temperature Trad (solid) for each of the three lines. The gas temperature Tgas is added for comparison. Bottom panel: scaled height variation of the total (line plus continuum) opacity per gram κ at the center of each line. The curve coding is the same as in the top panel. Note the compressed scale for the Ca line; its peak at z = 0 is 24 times the corresponding peak for the Mg line.
Current usage metrics show cumulative count of Article Views (full-text article views including HTML views, PDF and ePub downloads, according to the available data) and Abstracts Views on Vision4Press platform.
Data correspond to usage on the plateform after 2015. The current usage metrics is available 48-96 hours after online publication and is updated daily on week days.
Initial download of the metrics may take a while.