Fig. 10
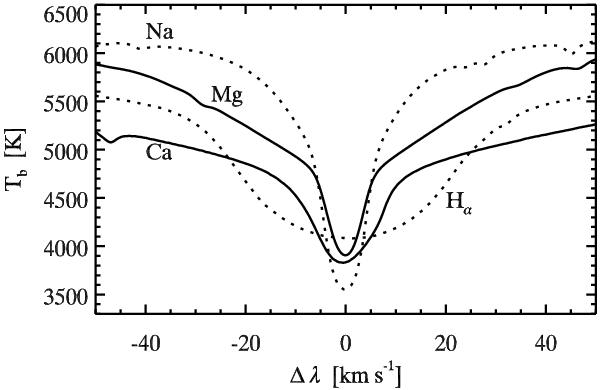
Strong lines in the red part of the solar spectrum. Disk-center profiles of the Na line (Na I 5895.940 Å; dotted), the Mg line (Mg I 5172.698 Å), the Ca line (Ca II 8542.144 Å) and Hα (H I 6562.808 Å, dotted) from the FTS atlas are shown on common scales. The atlas calibration by Neckel & Labs (1984) was used to convert the intensities into formal brightness temperatures. The wavelengths were converted into formal Dopplershifts from line center, with redshift positive.
Current usage metrics show cumulative count of Article Views (full-text article views including HTML views, PDF and ePub downloads, according to the available data) and Abstracts Views on Vision4Press platform.
Data correspond to usage on the plateform after 2015. The current usage metrics is available 48-96 hours after online publication and is updated daily on week days.
Initial download of the metrics may take a while.