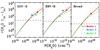
Fig. B.2

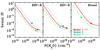
Top: τ of the H O 110–101 line. The black dashed line corresponds to the observed value in each of the three velocity components as specified in Sect. 2. Bottom: beam-filling factor for the three different components and three different models as a function of total H2O column density. Best-fit results are marked with points in both plots.
Current usage metrics show cumulative count of Article Views (full-text article views including HTML views, PDF and ePub downloads, according to the available data) and Abstracts Views on Vision4Press platform.
Data correspond to usage on the plateform after 2015. The current usage metrics is available 48-96 hours after online publication and is updated daily on week days.
Initial download of the metrics may take a while.