Fig. B.1
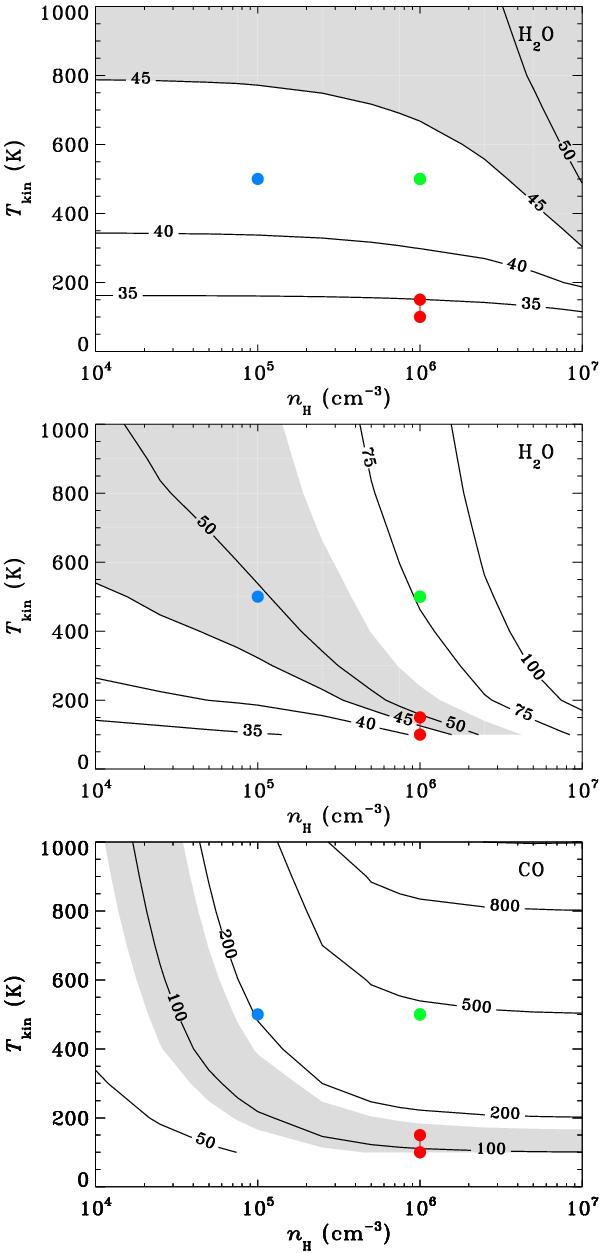
Trot of optically thin H2O emission (top), optically thick H2O emission (N = 1017 cm-2; middle) and optically thin CO emission (bottom) determined from RADEX simulations. Trot is calculated from the same transitions as in Sect. 2, i.e., excluding the ground-state transitions. The gray area indicates the observed values of Trot. The points indicate the different physical conditions examined; model 1 (red) has (T, n) = (150 K, 106 cm-3) for the EHV components and (100 K, 106 cm-3) for the broad component. Model 2 (blue) has (T, n) = (500 K, 105 cm-3) for the EHV components, respectively. Model 3 (green) has (T, n) = (500 K, 106 cm-3) for all components.
Current usage metrics show cumulative count of Article Views (full-text article views including HTML views, PDF and ePub downloads, according to the available data) and Abstracts Views on Vision4Press platform.
Data correspond to usage on the plateform after 2015. The current usage metrics is available 48-96 hours after online publication and is updated daily on week days.
Initial download of the metrics may take a while.