Free Access
Fig. 2
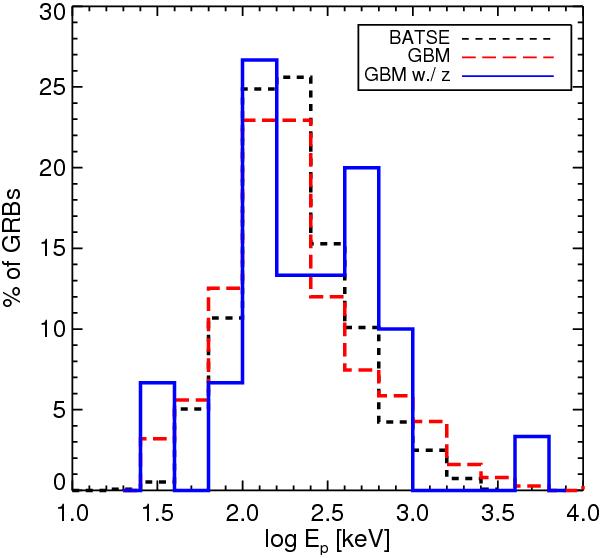
Ep values of 1367 BATSE/CGRO GRBs with a log-normal fit (black dotted histogram and line), 375 GBM GRBs and log-normal fit (red dashed histogram and line) and 30 GBM GRBs with redshift measurement (blue solid histogram). A KS test suggests that all three samples were drawn from the same distribution.
Current usage metrics show cumulative count of Article Views (full-text article views including HTML views, PDF and ePub downloads, according to the available data) and Abstracts Views on Vision4Press platform.
Data correspond to usage on the plateform after 2015. The current usage metrics is available 48-96 hours after online publication and is updated daily on week days.
Initial download of the metrics may take a while.