Free Access
Fig. 1
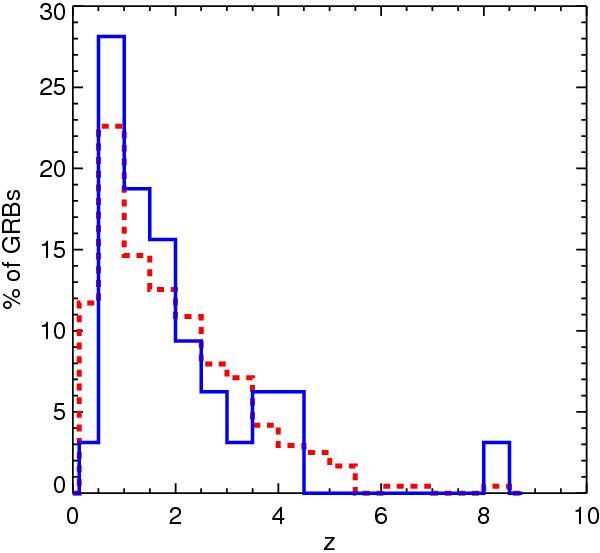
Redshift distribution in % of GBM GRBs (blue solid line) compared to all 239 GRBs with measured redshift to date (red dashed line). Both samples contain long and short bursts.
Current usage metrics show cumulative count of Article Views (full-text article views including HTML views, PDF and ePub downloads, according to the available data) and Abstracts Views on Vision4Press platform.
Data correspond to usage on the plateform after 2015. The current usage metrics is available 48-96 hours after online publication and is updated daily on week days.
Initial download of the metrics may take a while.