Fig. 8
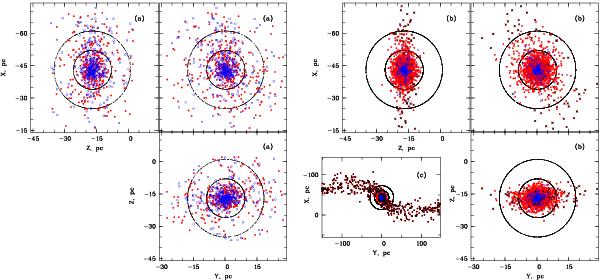
Observed a) and modelled b), c) spatial distribution in the Hyades. Blue points are for stars with masses m > 0.5 m⊙, red points for m ≤ 0.5 m⊙. In the modelled distribution, the dynamically unbound particles are marked by black crosses b) or black points c). Two large black circles in a) and b) indicate the distances rc from the cluster centre of 9 pc and 18 pc, whereas in c) the circles correspond to rc = 9 pc, rc = 18 pc, and rc = 30 pc. The last one restricts the area considered in this study.
Current usage metrics show cumulative count of Article Views (full-text article views including HTML views, PDF and ePub downloads, according to the available data) and Abstracts Views on Vision4Press platform.
Data correspond to usage on the plateform after 2015. The current usage metrics is available 48-96 hours after online publication and is updated daily on week days.
Initial download of the metrics may take a while.