Fig. 7
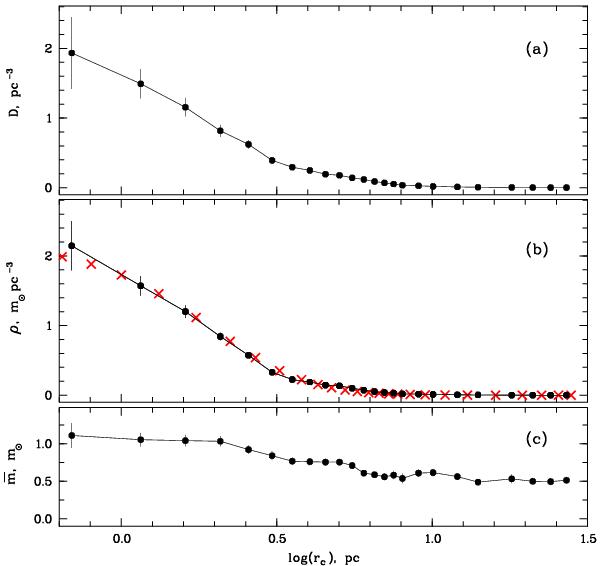
The dependence of number density, mass density, and average mass per star as a function of the logarithm of the distance from the centre rc. From top to bottom: a) the number density D of stars in the cluster obtained with a binning of 2 pc in steps of 1 pc. Outside 10 pc the bin size is increased to get a better signal-to-noise ratio. The error bars are Poisson errors; b) the observed mass density ρ (black dots) using the same binning and a density distribution (red crosses) from a Plummer model (Eq. (4) with Mt = 276 m⊙ and rco = 3.10 pc); c) the average mass per star obtained as ρ/D. Its decrease from the centre outbound characterises the mass segregation in the Hyades, at present time.
Current usage metrics show cumulative count of Article Views (full-text article views including HTML views, PDF and ePub downloads, according to the available data) and Abstracts Views on Vision4Press platform.
Data correspond to usage on the plateform after 2015. The current usage metrics is available 48-96 hours after online publication and is updated daily on week days.
Initial download of the metrics may take a while.