Fig. 10
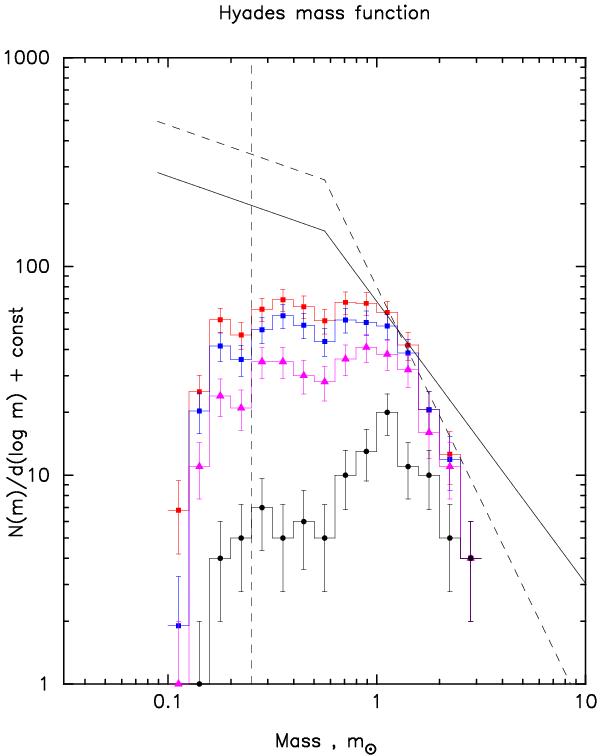
The present-day mass function (PDMF) of the Hyades. The lowest histogram (filled black dots) shows the PDMF in the core of the cluster (rc < 3.1 pc), the magenta triangles mark the PDMF within the tidal radius (rc < 9 pc), the blue squares stand for the PDMF in the region rc < 18 pc, and finally the filled red squares are the PDMF of all 724 stars within 30 pc from the centre. The PDMFs are corrected for field star contamination. The histograms give the actual star counts per logarithmic mass bin of 0.1. The dashed vertical line at about 0.25 m⊙ marks the onset of incompleteness of our survey. For comparison, we show a Kroupa (2001) mass function (solid line) with α = 2.35 for masses larger than 0.5 m⊙, and α = 1.35 below 0.5 m⊙. As an other extreme we show a mass function with slope α = 3.05 (dashed line) fitted to the high-mass portion of the observed PDMF.
Current usage metrics show cumulative count of Article Views (full-text article views including HTML views, PDF and ePub downloads, according to the available data) and Abstracts Views on Vision4Press platform.
Data correspond to usage on the plateform after 2015. The current usage metrics is available 48-96 hours after online publication and is updated daily on week days.
Initial download of the metrics may take a while.