Fig. A.3
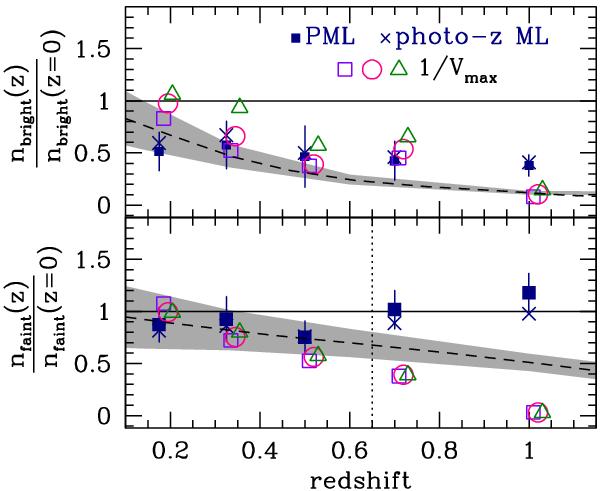
Ratios of ETG number densities at a given redshift with respect to the z ~ 0 true luminosity function in the numerical simulation. The horizontal solid line shows the unit ratio. The solid squares show the results from the mocks for the r-band from PML estimates of the LF; the errorbars are shown only for this case for clarity (and were scaled to an area of 0.25 sq. degrees). The crosses show the results from the photo-z maximum likelihood measurement. The open symbols show the results from the 1/Vmax weighted estimates of the mock LFs, obtained using the true redshifts (open squares), the photometric redshifts (open circles), and the photo-zs convolved with their uncertainties (open triangles). Small displacements along the x-axis were added for clarity. The dashed lines correspond to the evolution inferred from the De Lucia et al. (2006) semi-analytic model (coincident with the evolution enforced in our model galaxies; see the text). The grey shaded area shows the estimated cosmic variance in a 0.25 sq. degree light-cone survey divided into slices of Δz = 0.1. Top panel: samples of bright ETG galaxies. Lower panels: faint ETGs; the dotted vertical line shows the redshift limit for accurate faint ratios.
Current usage metrics show cumulative count of Article Views (full-text article views including HTML views, PDF and ePub downloads, according to the available data) and Abstracts Views on Vision4Press platform.
Data correspond to usage on the plateform after 2015. The current usage metrics is available 48-96 hours after online publication and is updated daily on week days.
Initial download of the metrics may take a while.