Fig. A.1
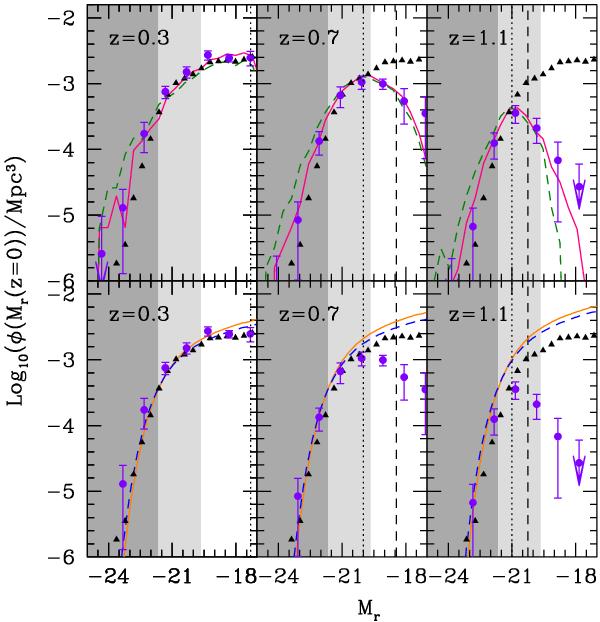
Effect of redshift measurement errors on the luminosity function as found using mock MUSYC catalogues, analysed in three redshift bins (increasing from left to right). In all panels, the triangles show the true, evolving r-band ETG LF of the full simulation box. Top panels: LFs calculated using the 1/Vmax weighting method. Filled circles show the results from using the true redshifts in the mock catalogues, the solid lines indicate the results when adopting photo-zs, the dashed lines shows the effect of a further convolution with the photo-z errors. Bottom panels: the filled circles are as in the top panels. The solid lines correspond to the PML estimates of the LF from the mock, the dashed lines to the photo-z based maximum likelihood estimator (C09). Shaded areas and vertical dashed lines are as in Fig. 1. The vertical dotted line shows the magnitude above which the recovery of the LF using the true redshift starts to degrade. Errorbars show Poisson uncertainties.
Current usage metrics show cumulative count of Article Views (full-text article views including HTML views, PDF and ePub downloads, according to the available data) and Abstracts Views on Vision4Press platform.
Data correspond to usage on the plateform after 2015. The current usage metrics is available 48-96 hours after online publication and is updated daily on week days.
Initial download of the metrics may take a while.