Fig. 4
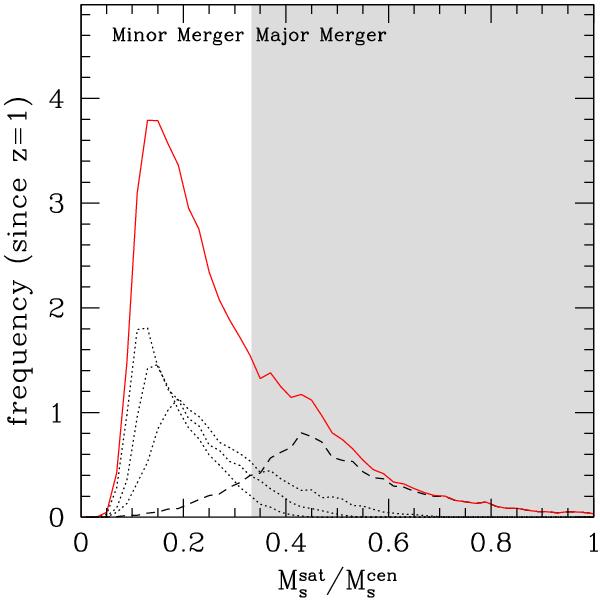
Frequency of stellar mass ratios of ETG galaxies involved in mergers for the case of z = 1 progenitors with Mr(z = 0) < −19.7 (i.e. stellar masses above ~1010 h-1 M⊙) and their z = 0 descendants for a total of four mergers per descendant. The solid line shows the sum of all merger events, dashed corresponds to mergers between central galaxies, dotted to mergers between a central and one of its satellites. The shaded region corresponds to ratios above the limit for a major merger (mass ratio of 1/3 and higher).
Current usage metrics show cumulative count of Article Views (full-text article views including HTML views, PDF and ePub downloads, according to the available data) and Abstracts Views on Vision4Press platform.
Data correspond to usage on the plateform after 2015. The current usage metrics is available 48-96 hours after online publication and is updated daily on week days.
Initial download of the metrics may take a while.