Fig. 3
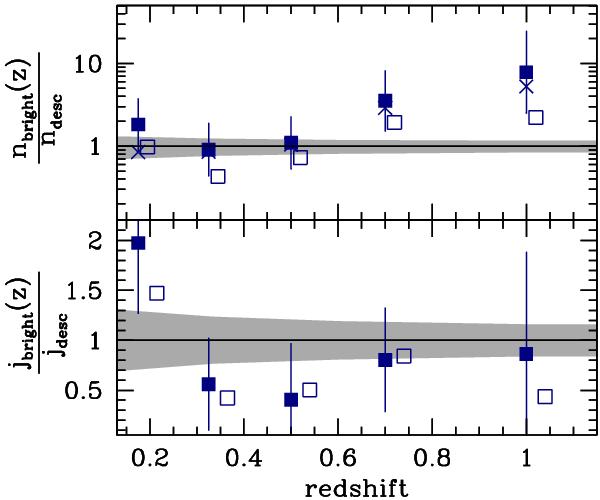
Top panel: ratio between the number density of progenitor ETGs with stellar masses Ms > 1010 h-1 M⊙ at a given redshift and their expected z = 0 descendants as inferred from the clustering analysis of P10. The filled squares show the results from using the PML r-band LF estimates; open squares show the results for the B-band. Errorbars are only shown for the r-band result to improve clarity; errors for the B-band show similar amplitudes. The crosses correspond to the results from the photo-z based maximum likelihood method to calculate the LF in the r-band. The solid line shows the unit ratio and the grey shaded area shows the estimated cosmic variance in a 0.25 sq. degree light-cone survey divided in slices of Δz = 0.1. Obviously, the number density of high-redshift progenitors is higher than that of their z = 0 descendants; this is not the case for progenitors at z < 0.6 and their z = 0 descendants. Bottom panel: ratio between the luminosity density of progenitor ETGs and that of their z = 0 ETG descendants in the r- and B-bands (filled and open squares, respectively). Regardless of the progenitor redshift, the luminosity density ratios shown are consistent with the unit value.
Current usage metrics show cumulative count of Article Views (full-text article views including HTML views, PDF and ePub downloads, according to the available data) and Abstracts Views on Vision4Press platform.
Data correspond to usage on the plateform after 2015. The current usage metrics is available 48-96 hours after online publication and is updated daily on week days.
Initial download of the metrics may take a while.