Fig. 2
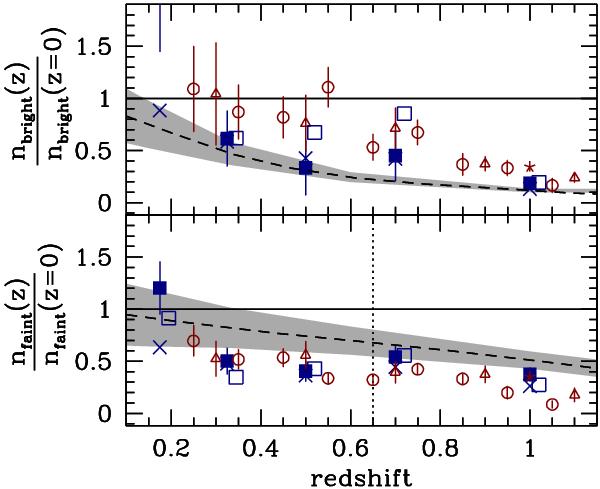
Ratios of ETG number densities at a given redshift with respect to a z ~ 0 SDSS sample. The horizontal solid lines show the unit ratio. The shaded areas show the cosmic variance as calculated in Appendix A2. The squares show the results from MUSYC for the r-band (solid symbols) and the B-band (open symbols, slightly displaced on the x-axis) from PML estimates of the LF; the errorbars for the results in the two bands (r and B) are similar, but are shown only for the r-band to improve clarity. The crosses show the results from the r-band LF calculated using the photo-z based maximum likelihood method. The circles correspond to results from the COMBO-17 ETG LF estimate, triangles to DEEP2, and stars to the SXDS. Top panel: samples of bright ETG galaxies. Lower panels: faint ETGs. Comparing the shaded area and symbols, a marginal agreement between the evolution in models and observations can be noticed.
Current usage metrics show cumulative count of Article Views (full-text article views including HTML views, PDF and ePub downloads, according to the available data) and Abstracts Views on Vision4Press platform.
Data correspond to usage on the plateform after 2015. The current usage metrics is available 48-96 hours after online publication and is updated daily on week days.
Initial download of the metrics may take a while.