Fig. 1
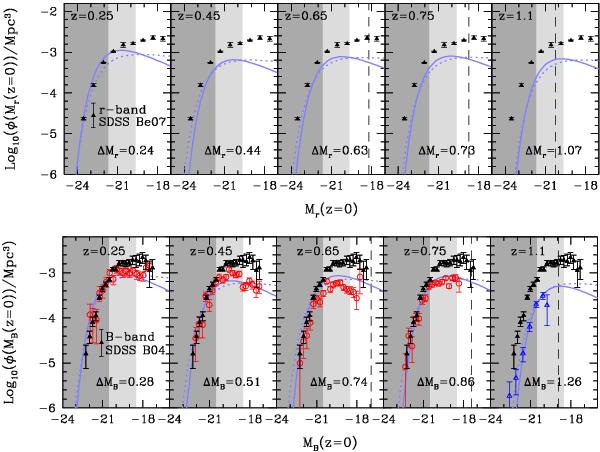
Luminosity functions of ETGs at different redshifts passively evolved to z = 0 (with redshift increasing from the left to the right panels as indicated in the key). The top and bottom rows show estimates in the r- and B-band, respectively, and for comparison the black solid triangles show the z ≃ 0.165 SDSS ETG LF from Benson et al. (2007) in all the top panels, and from B04 in all the bottom panels. Red circles show the results from COMBO-17 (B04) and blue open triangles those from DEEP2 (Faber et al. 2007). The thick light-blue solid and dotted lines show results from MUSYC, obtained via the PML and a photo-z based maximum likelihood methods by C09, respectively. The amount of evolution applied to the B and r-band luminosities is indicated in each panel. The shaded areas delimit the bright and faint ETG populations (dark and light grey, respectively). The vertical dashed lines (only visible in the subpanels corresponding to z ≥ 0.74) mark the MUSYC completeness limit.
Current usage metrics show cumulative count of Article Views (full-text article views including HTML views, PDF and ePub downloads, according to the available data) and Abstracts Views on Vision4Press platform.
Data correspond to usage on the plateform after 2015. The current usage metrics is available 48-96 hours after online publication and is updated daily on week days.
Initial download of the metrics may take a while.