Fig. 4
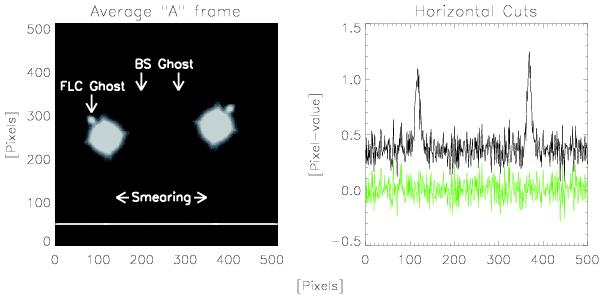
Left: raw image, plotted at very high contrast. Two spurious ghosts can be seen above the star (discussed below in Sect. 6.4). The horizontal white line represents the plot that is shown on the right. Right: the black line shows the horizontal cut before the correction, the green line shows the smearing correction effect described in Sect. 3.2.
Current usage metrics show cumulative count of Article Views (full-text article views including HTML views, PDF and ePub downloads, according to the available data) and Abstracts Views on Vision4Press platform.
Data correspond to usage on the plateform after 2015. The current usage metrics is available 48-96 hours after online publication and is updated daily on week days.
Initial download of the metrics may take a while.