Fig. 8
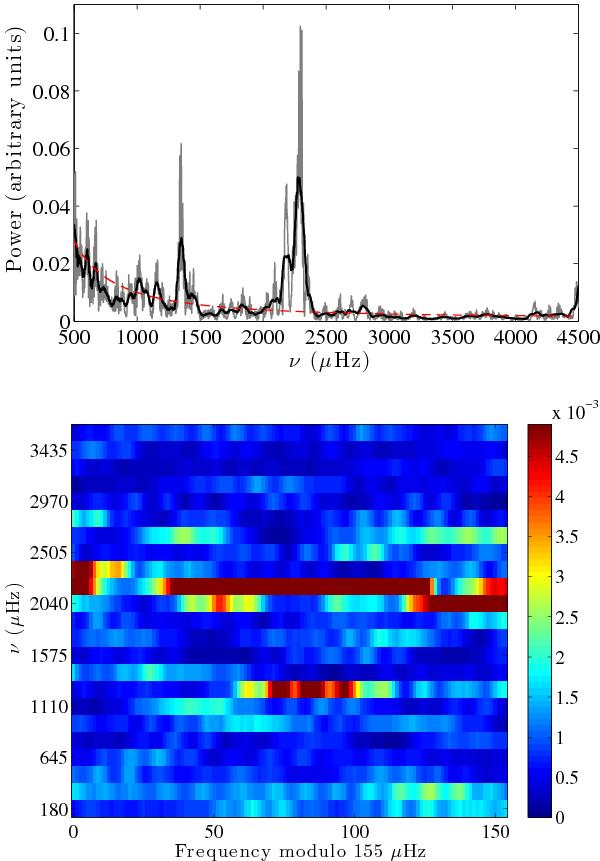
Top panel: power spectrum of the photometric time series described in 2.2. As in Fig. 2, the thin grey and bold black lines represent the power spectrum smoothed with a 3.1-μHz wide triangular window, and a linearly increasing width triangular window, from 14 to 129 μHz across the [500, 4500] μHz frequency range, respectively. The spectrum is normalized such that its maximum value equals 1. The red dashed line indicates the background level fit. Bottom panel: échelle diagram of the power spectrum for a folding frequency of Δν0 = 155 μHz, calculated in the same way as in Fig. 5.
Current usage metrics show cumulative count of Article Views (full-text article views including HTML views, PDF and ePub downloads, according to the available data) and Abstracts Views on Vision4Press platform.
Data correspond to usage on the plateform after 2015. The current usage metrics is available 48-96 hours after online publication and is updated daily on week days.
Initial download of the metrics may take a while.