Fig. 7
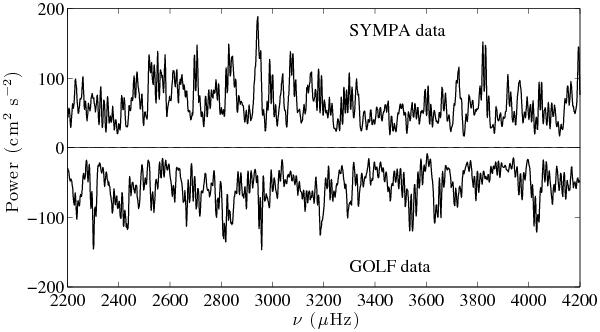
Power spectra of SYMPA (top) and GOLF/SOHO data (bottom). The Jupiter data is a zoom of the power spectrum plotted in Fig. 2. The solar spectrum was obtained by using the GOLF/SOHO data on a 9.27-day run, in early April 2005, with the same window function and the same noise level as SYMPA: the GOLF data were interpolated on the same time grid, then a white noise with standard deviation corresponding to those of SYMPA’s data (18.6 m s-1) was added.
Current usage metrics show cumulative count of Article Views (full-text article views including HTML views, PDF and ePub downloads, according to the available data) and Abstracts Views on Vision4Press platform.
Data correspond to usage on the plateform after 2015. The current usage metrics is available 48-96 hours after online publication and is updated daily on week days.
Initial download of the metrics may take a while.