Fig. 6
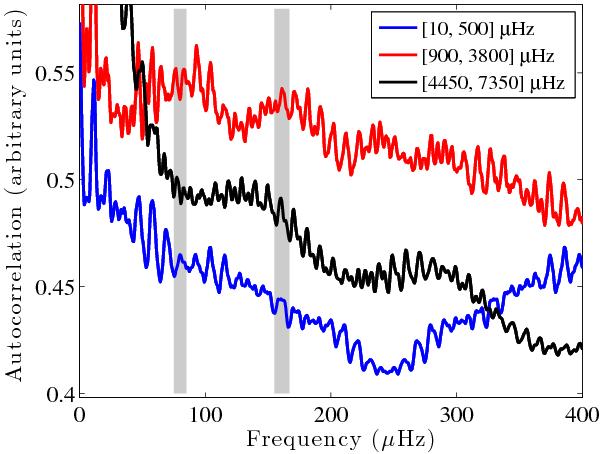
Autocorrelation of the power spectrum in three frequency ranges. The blue curve shows the low frequencies [10, 500] μHz, which are dominated by Jovian rotation, and optical path difference fluctuations of the interferometer, generated by temperature fluctuations. The black curve shows the frequency range dominated by the pointing errors [4450, 7350] μHz. The red curve shows the [900, 3800] μHz range, where we measure a double excess power. Only this last curve displays a modulation at about 160 ± 5 μHz, indicated with the grey region, as well as at its half value.
Current usage metrics show cumulative count of Article Views (full-text article views including HTML views, PDF and ePub downloads, according to the available data) and Abstracts Views on Vision4Press platform.
Data correspond to usage on the plateform after 2015. The current usage metrics is available 48-96 hours after online publication and is updated daily on week days.
Initial download of the metrics may take a while.