Fig. 2
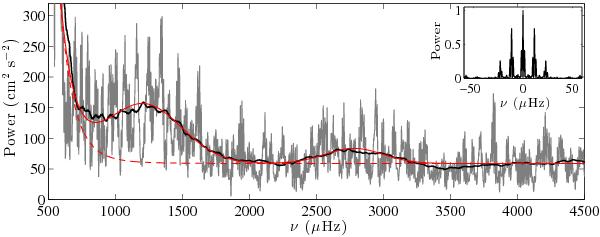
Power spectrum of the time series associated with the spherical harmonics of degree l = 1. The thin grey and bold black lines represent the power spectrum smoothed with a moving average, weighted by a triangular window, with two different scales. The grey line uses a 3.1-μHz wide window, and the black line a linearly increasing width window, from 14 to 129 μHz across the [500, 4500] μHz frequency range. The red dashed line indicates the background level fit and the full red line the background plus excess power fit. The upper plot represents the power spectrum of the window function, normalized such that its maximum value equals 1.
Current usage metrics show cumulative count of Article Views (full-text article views including HTML views, PDF and ePub downloads, according to the available data) and Abstracts Views on Vision4Press platform.
Data correspond to usage on the plateform after 2015. The current usage metrics is available 48-96 hours after online publication and is updated daily on week days.
Initial download of the metrics may take a while.