Fig. 8
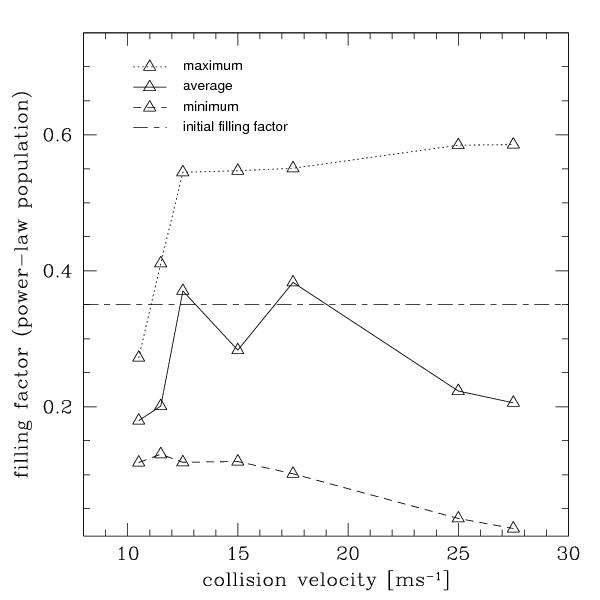
Final average filling factor (black line) of the power-law populations in each of the simulations. We also plot the maximum (upper grey line) and minimum (lower grey line) filling factors for each simulation, as well as the initial filling factor (dashed line). As the collision velocity increases, the range of filling factors for any one simulation increases.
Current usage metrics show cumulative count of Article Views (full-text article views including HTML views, PDF and ePub downloads, according to the available data) and Abstracts Views on Vision4Press platform.
Data correspond to usage on the plateform after 2015. The current usage metrics is available 48-96 hours after online publication and is updated daily on week days.
Initial download of the metrics may take a while.