Fig. 2
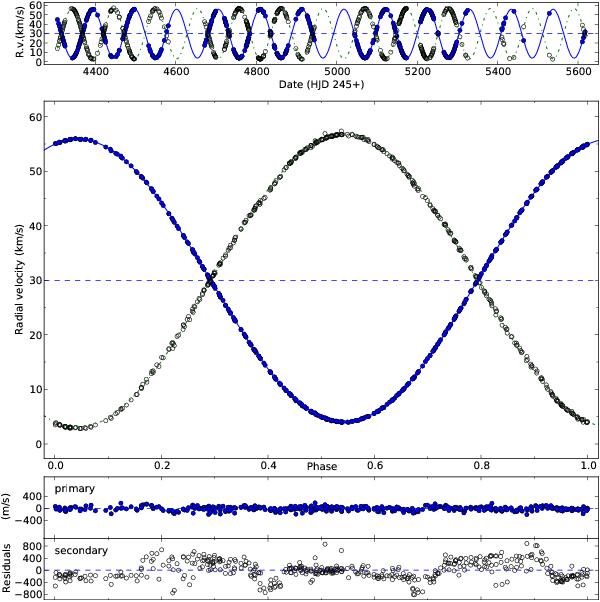
The STELLA radial velocities compared with our newly computed orbit. Filled circles denote the cool component, star A, open circles the hot component, star B. The two top panels show the radial velocities versus HJD and versus orbital phase, the two bottom panels show the residuals versus phase for the primary and the secondary, respectively. The lines are computed from our elements in Table 2. The horizontal dashed line in the middle panel is the systemic velocity. The residuals show a phase-dependent behavior in both components, but the overall rms of 64 m s-1 and 297 m s-1 for the two components fit the uncertainties of the individual measurements quite well.
Current usage metrics show cumulative count of Article Views (full-text article views including HTML views, PDF and ePub downloads, according to the available data) and Abstracts Views on Vision4Press platform.
Data correspond to usage on the plateform after 2015. The current usage metrics is available 48-96 hours after online publication and is updated daily on week days.
Initial download of the metrics may take a while.